Lately I'm paying more attention to the crypto currency and "DeFi" spaces, again.
One discussion that comes up regularly: are miners to blame for the high GPU prices?
To add some facts to this discussion, I’ve done a small analysis of GPU and crypto currency prices to determine if they are related.
Data Sources
GPU Prices
For GPU prices I used the german website https://geizhals.de.
The website shows the prices of items over a time frame of six months.
The data of the plots is delivered as JSON and can be easily scraped.
I scraped the pricing data for the four current-gen NVIDIA graphics cards (RTX 3060 - 3090).
As multiple manufacturers sell the same graphics card chips, I averaged the prices per chip.
Crypto Currency Prices
I used Yahoo! Finance as my source for the crypto currency prices. You can download the historic data as CSV.
Evaluation
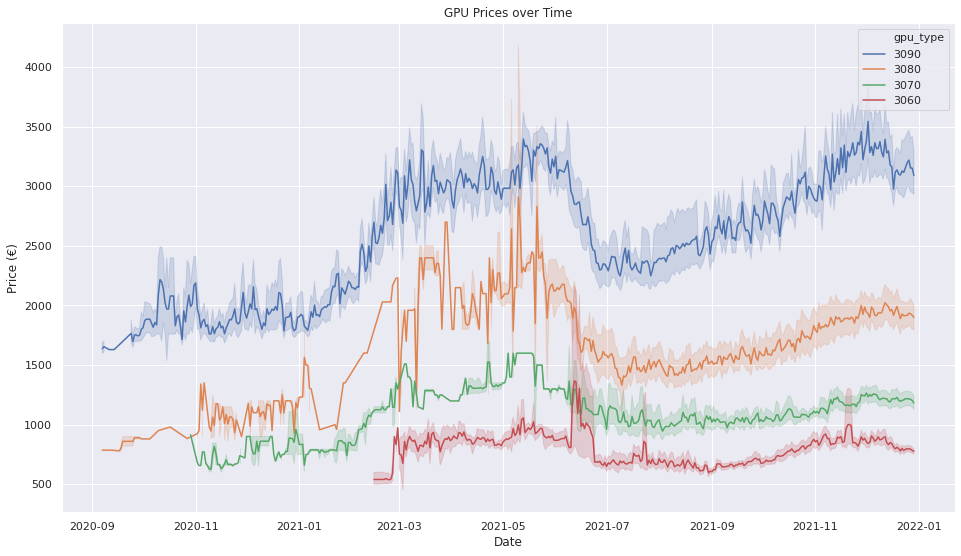
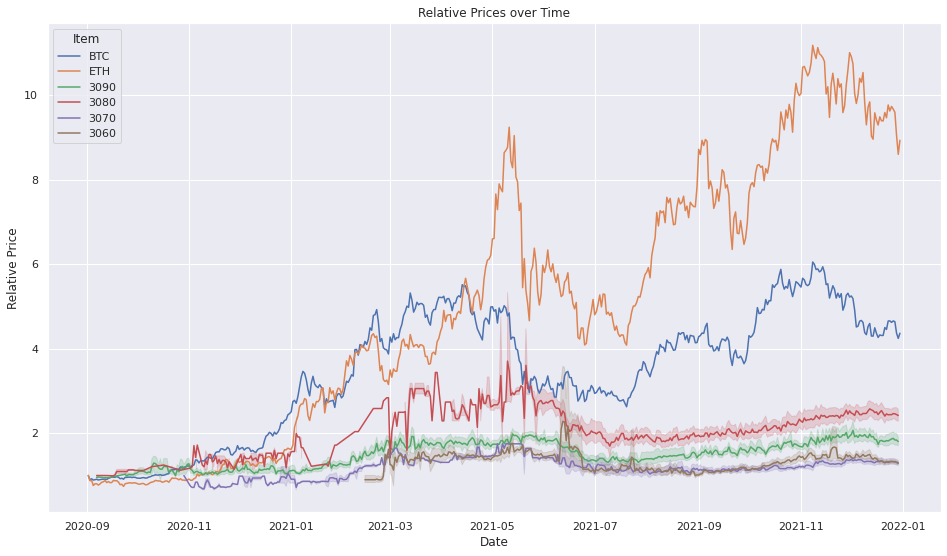
For a first impression, I’ve added the bitcoin price to the plot of GPU prices.
To normalize the prices, I divided each time series value by the first price observed.
Squinting at this plot, you can already see that the overall trend in prices roughly line up.
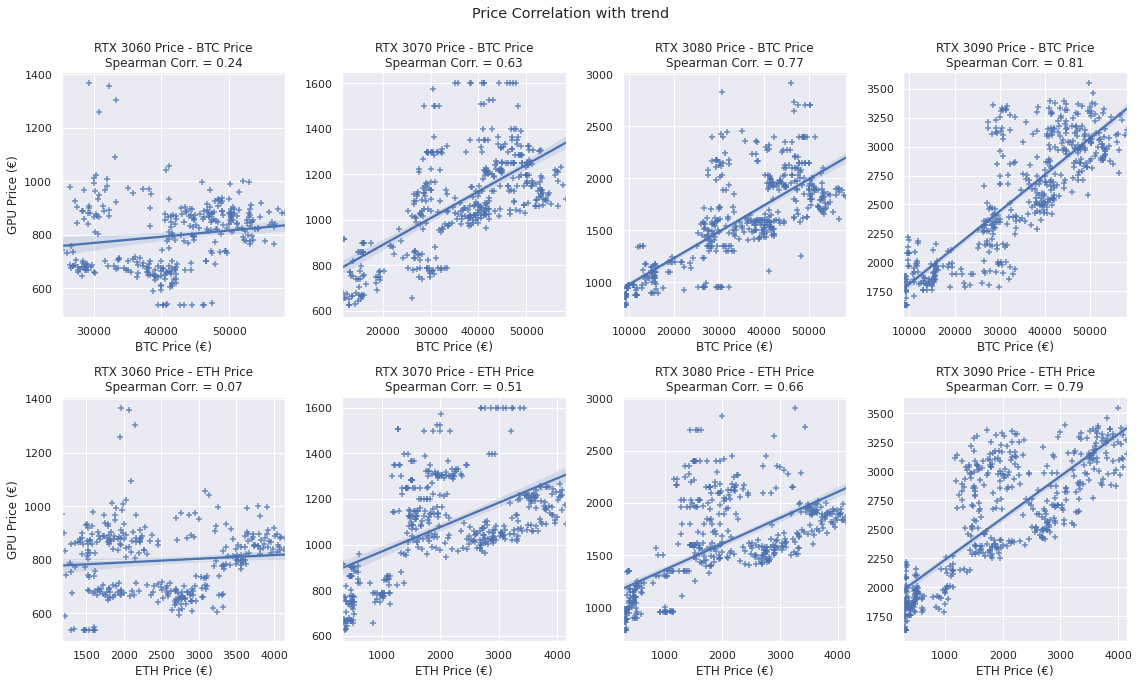
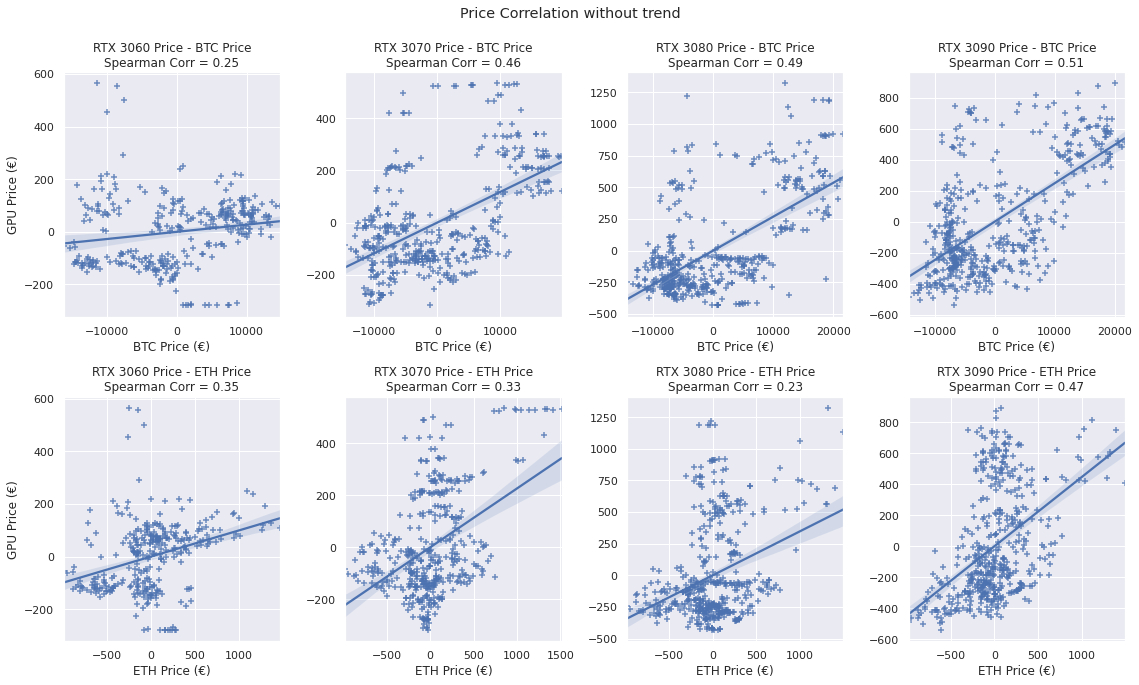
For a more accurate analysis, I looked at the correlation factors and created corresponding scatter plots.
Each dot in the plots represents one day.
The Y-axis shows the price of the GPU at that day and the X-axis the price of the crypto currency.
If prices correlated perfectly, all dots would lie on a diagonal line.
For the RTX 3060, there is only a weak correlation between prices.
The correlation between RTX 3060 and ETH prices is not significant and has to be discarded.
Keep in mind that the 3060 was just released on 26 of February, so we have less pricing data compared to the other GPUs.
For the other cards, we see higher correlation factors.
Whenever the price of one rose, the other rose too.
The effect is strongest for the RTX 3090 and is visible in Bitcoin and Ethereum.
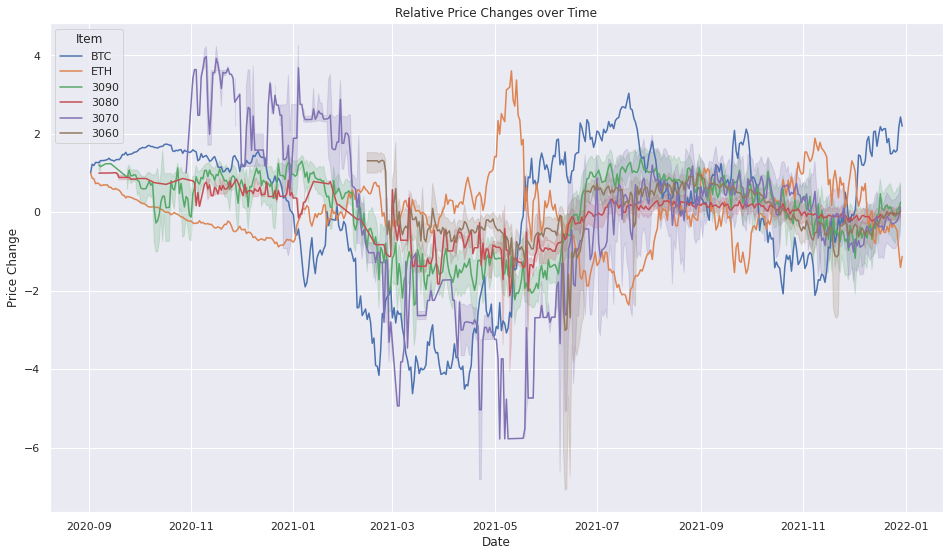
This analysis still has a flaw, as it does not correct for the overall trend in the price development.
Prices change over time because of factors affecting all products.
For example, inflation will rise all prices over longer observations.
This creates a false correlation if you compare prices over a long time frame.
To correct for this, the overall trend has to be removed from the data.
I used a linear regression to remove the trend.
With the trend removed, the measured correlation between the prices is weaker, as expected, as we removed a linear factor from the data.
The data still shows a correlation between crypto currency and GPU prices.
The correlation is stronger for Bitcoin than for Ethereum.
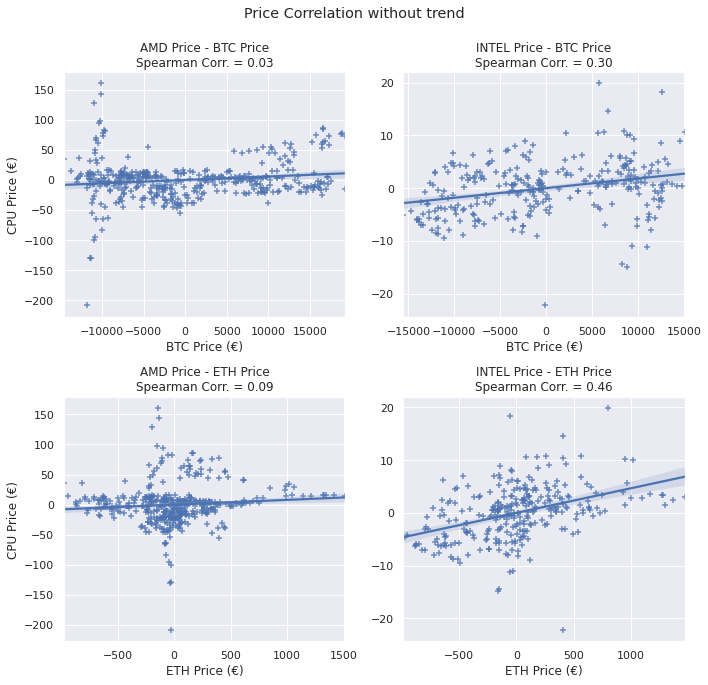
To test the validity of these correlations, I did the same analysis for CPU from AMD and Intel.
I used the prices of the generations; Ryzen 5000 and i-11000.
The AMD prices show no correlation with the crypto currency prices (p-value below 0.05).
For Intel chips, we can observe a slight correlation.
This gives me more confidence that the correlation is real for GPUs.
Conclusion
We can see a correlation between GPU prices and the value of crypto currencies, but correlation does not mean causation.
A causation is plausible in this case.
Miners earn a lot of money with their businesses and can predict how much they will earn on average with each graphics card.
As long as their earnings are high enough, it is profitable for miners to buy cards at higher prices.
Bitcoin miners rarely use GPUs anymore, but ASICs.
The production of ASICs may add more price pressure on silicon and chip production.
I don't have any data on the amount of production capacity being used by ASICs, so I don't know how much pressure they produce.
Why is this a problem? There is nothing inherent to blockchains that demands such a high dependence on computing hardware.
The resources spent by miners only serves as a mechanism to increase the cost of changing data in the blockchain.
This cost serves as a mechanism to secure blockchain.
Other mechanism for securing blockchains exist and successfully used (see Proof of Stake).
Proof of Work creates external costs (environmental impact, higher electricity prices, GPU scarcity) to benefit a small group of miners.
NFTs in gaming are just a bad idea.
They create artificial scarcity in order to create a pure manifestation of capitalism in the gaming world.
This is not fun! Games should allow you to escape from reality, not bring the problems of real life into virtual life.
Do gamers want this? Ask any gamer about pay-to-win, or in-game purchases, and you got your answer.
Alternative Financing
What are the alternatives? Let’s imagine the manifestation of another ideology: Communism.
Everybody pays as much as they can spare to game developers.
The game developers use this money to pay artists and developers, which create the content of the former NFTs.
Every player can use these new skins and items, no matter how much they paid.
There is no special treatment for paying more.
Your sole motivation for paying is liking the games and wanting to see it grow.
This is certainly better than NFTs, but still does not enhance the game.
A game where you cannot progress or achieve anything is boring.
So let’s mix in meritocracy.
We still finance the content as above, however it’s not given to the players directly.
Instead, the items/skins are tied to achievements in the game in a deterministic way.
Want that new sword skin? Win 100 fights in the Arena of Doom.
This gives players a goal and rewards skill in the game.
I think these two principles create a system which most gamers will like.
You don’t have to pay for new skins/items, but you can still brag about your new skin because everyone knows how hard it is to obtain.
This would also be an improvement over the current system of micro transactions and in-game purchases.
Now you may ask: “But what about sharing items between games? That’s the whole reason for using blockchain and NFT.”
Decentralization and Ownership
Blockchain will not solve the problem of sharing items between games.
Tracking ownership is the smallest of problems.
The more hard questions are:
How do you translate item stats from one game to the other?
How do you exchange assets in a unified way?
How do you convince large publishers to open up their ecosystems?
First, we need to find a common way to connect game account with each other.
An established method is OAuth2.
This would allow players to connect accounts of different games.
Once connected, your game can retrieve the list of items a player unlocked in the other game.
Another possibility, and a more decentralized method, is the Solid Project, where your data is stored in a place you control.
This would have the added benefit that your game assets still exist when the publisher of the stops maintaining the game.
Additionally to authentication, we need an API to exchange information about the in-game assets between games.
The API needs to present items in a standardized way, which is still flexible enough to cover “all” items in games.
One possibility would be to use RDF and define a standard vocabulary for game items.
RDF uses three-part structure to describe properties of subjects.
With in-game items, this would be equivalent to: “sword is green”, “sword has +3 strength”.
By defining a standard vocabulary (e.g.
how to represent colors), games could easily translate from the common description to in-game attributes.
You might also want to include assets in the API.
Again, we need heavy standardized representation (e.g.
glTF or obj for 3D assets, PNG for images, ...).
These assets would mostly only serve as references for designers to create their own assets.
Games are art pieces, and it is almost impossible to share assets between them in an automated way.
Once our authentication flows and APIs are defined, we can integrate them into games.
This still requires work from artists and programmers.
The game developers decide which game they want to support for exchanging items with.
Connecting two shooters is easier than connecting a fantasy RPG to a sci-fi strategy game.
Using the assets API the designers change or recreate the assets to be used in their game and adjust the stats to be balanced.
When the players connect their game accounts, the information about ownership is exchanged, and the modified items awarded to the player.
Most games will probably only support game connections with similar settings where the translation is straightforward.
But over time, more and more games will build connections between varying genres.
At this point the true power of a federated system starts.
The connections of games build a graph.
This allows you to support many game connections without explicitly connecting them.
A player earns an item in Game A.
This item is translated to another item in Game B.
If your game supports a connection to Game B, it can automatically supports all items which are also supported by Game B.
This way, your game will automatically accept more and more items from different games without more work for the designers.
Conclusion
I think this creates a system that is beneficial to all participants.
New games will use connection to popular, similar games to attract players to their game.
Players that get a bit tired of a game can swap to new games and take (some) of their assets over.
Large publishers might use this system to cross promote their games.
For the configuration of the RabbitMQ server we will use a rabbitmq.conf and a definitions.json. I stored these files in a rabbitmq folder to keep my project folder structure clean. This setup is derived from sudos answer on StackOverflow
The rabbitmq.conf deactivates the default guest user and tells RabbitMQ to load the definition file.
#!/usr/bin/env python3

# rabbitMQ password hashing algo as laid out in:
# http://lists.rabbitmq.com/pipermail/rabbitmq-discuss/2011-May/012765.html

from __future__ import print_function
import base64
import os
import hashlib
import struct
import sys

# This is the password we wish to encode
password = sys.argv[1]

# 1.Generate a random 32 bit salt:
# This will generate 32 bits of random data:
salt = os.urandom(4)

# 2.Concatenate that with the UTF-8 representation of the plaintext password
tmp0 = salt + password.encode('utf-8')

# 3. Take the SHA256 hash and get the bytes back
tmp1 = hashlib.sha256(tmp0).digest()

# 4. Concatenate the salt again:
salted_hash = salt + tmp1

# 5. convert to base64 encoding:
pass_hash = base64.b64encode(salted_hash)

print(pass_hash.decode("utf-8"))
In the last months I've spent a lot of my time researching and thinking about the ecological impact of blockchain.
Bitcoin and Ethereum, the two most popular blockchain technologies, have a vast power consumption.
The power consumption is not inherent to blockchain technologies, but a result of the way these blockchains are secured.
The network of computers running Bitcoin and Ethereum establish trust by making changes to the blockchain expensive.
This is achieved by requiring to solve a puzzle whenever you want to append something to the chain.
Miners (people who solve these puzzles) have to spend money on hardware and electricity to solve the puzzles.
The difficulty of the puzzle is adjusted automatically with the number (and power) of computers trying to solve the puzzle.
Without adjusting the difficulty, changes would become inexpensive and the blockchain would become vulnerable.
This method of securing a blockchain is called "Proof of Work" (PoW).
There are other methods to establish trust in a blockchain network, like Proof of Stake (PoS), which require far less energy.
I want to focus on Proof of Work as this is the system which currently secures the most value in the crypto currency space.
It's hard to calculate the real power consumption of a blockchain.
Estimates are mostly concerned with the current hash rate (how many tries to solve the puzzle are executed each second) and the efficiency of the used hardware.
It is almost impossible to know how efficient the hardware used is which leads to large ranges in the estimation.
As of writing Bitcoins energy usage probably lies somewhere between 43 TWh and 477 TWh per year.
In the following I will not concern myself with the efficiency of the hardware.
Instead I try to derive the energy consumption of any blockchain (using PoW) from the value of the coins and how much miners are paid in block rewards.
Why miners mine
The reason why miners do their job of building and operating mining pools is simple: they want to earn money.
For each block that is found by a miner she earns some coins.
There are generally two ways miners are rewarded for their work:
First the miner can create some new coins for each found block.
The block rewards can change over time, for example bitcoin started with 50 BTC per block and the reward is lowered gradually until, eventually, no new coins are added to the blockchain.
This mechanism is used to create the initial pool of coins and to incentivise mining while very little transaction fees are available.
When the block reward is diminished over time transaction fees play an important role to incentivise mining.
When you create a transaction to be added to the blockchain a transaction fee can be added.
This fee is given to the miner who created the block containing the transaction.
Once no more coins are generated out of thin air the transaction fees have to pay the bills of the miners.
The block reward gives us an upper limit of the expenses of all miners.
If 10 BTC are earned on average per block, all miners combined can at most spent 10 BTC to create a new block.
If more resources were spent on creating a block over a longer period of time miners would go bankrupt.
Why efficiency does not matter
Miners have two main costs: hardware and electricity, everything else is overhead.
In order to be profitable they constantly try to minimize the price per computed hash.
The number of blocks generated by a miner is directly proportional to the percent of the global hash rate the miner controls.
A miner holding 1% of the global hash rate will be able to create 1% of the blocks.
As hardware gets more efficient, in terms of hashes per energy usage, miners will upgrade their hardware to minimize their cost and to secure more blocks.
When other miners upgrade their hardware too the advantage of a single miner is diminished as the improved hash rate is lost when everybody increases their hash rate.
This leads to a cycle of constant upgrade to stay ahead of the curve.
The upgrade cycle only leads to a higher global hash rate but does not lower the power consumption of the networks as a whole as miners only try to secure a bigger piece of the block reward cake.
If you look at mining from above, ignoring the single miner, you see a collective that constantly buys more efficient hardware but somehow manages not to reduce its power consumption.
Instead the power consumption of the collective is dictated by the rewards themself.
Higher rewards for mining, either by coins becoming more valuable or more fees being paid, lead to investments into mining equipment.
Existing miners buy more machines and new people start mining.
This leads to a higher energy consumption of the mining collective.
Any mining reward not used for new hardware (or kept as profit) will be used to buy energy to run the machines.
How much energy will be used
This gives us four factors that control the energy usage of all miners.
Block Reward: How much money can be earned by creating a block (Coin/Block)
Exchange Rate: What is the value of a coin ($/Coin)
Proportional Energy Costs: Which portion of the mining rewards is used for electricity (%)
Electricity Price: How much does an average miner pay for a kilowatt-hour ($/kWh)
The used energy of the network per block can be computed as:
([Block Reward] * [Exchange Rate] * [Proportional Energy Costs]) / [Energy Price]
 = [Energy Usage per Block]
Abstracting away blocks and exchange rates this could be simplified to:
a * [Daily Rewards] / [Energy Price] = [Daily Energy Usage]
where a is the proportion of the rewards used for energy
Blockchain Energy Usage Calculator
(The calculation assumes that a new block is generated every 10 minutes)
Revenue per Block:
{{revenue}} $
Energy per Block:
{{block}} GWh
Energy per Year:
{{year}} TWh
Conclusion
The energy consumption of a PoW blockchain is proportional to the value a miner can earn per block.
If the value of the reward doubles, either by higher fees or higher coin values, the energy consumption will double eventually.
Similarly the power consumption will rise if the price of energy drops.
A widely used blockchain, which potentially could replace fiat currencies, would have a high transaction amount leading to a large pool of fees to be collected by miners.
This would eventually lead to a corresponding energy consumption.
Ich hab einen Datensatz der schon länger bei mir auf der Platte liegt etwas aufbereitet und veröffentlicht.
Nach einem Vortrag auf der CozyConf über Datasette hab ich diesen Datensatz als Beispiel benutzt um das Tool einmal selbst auszuprobieren.